|
|

|
|
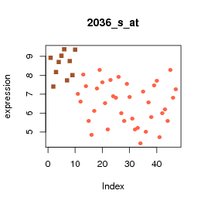
| Figure 8.2: The left panel shows the expression profile of a probe set from the ALLsub data. Square plot symbols correspond to the samples with the ALL1/AF4 molecular subtype ands circle symbols to BCR/ABL. The right panel is a barplot of frequencies with which the target genes of ALLsub map to the different human chromosomes. | |