![[Example1]](../../common/images/article268/example1.gif)
Example 2) Function Plots:
![[Example2]](../../common/images/article268/example2.gif)
Example 3) Contour Maps:
![[Example3]](../../common/images/article268/example3.gif)
Example 4) Images:
![[Example4]](../../common/images/article268/example4.gif)
Example 5) Histograms:
![[Example5]](../../common/images/article268/example5.gif)
![[bayboraseckin]](../../common/images/article268/bayborabenlinux.gif)
original in en Baybora Baran and Seckin Gokaltun
We are two research assistants at the Informatics Institute of ITU. We work with engineering applications with computers and we use Linux for this... Seckin's, homepage is at www.be.itu.edu.tr/~seckin
![[PgPlot for Linux]](../../common/images/article268/top.jpg)
The PGPLOT Graphics Library is a Fortran- or C-callable, device-independent graphics package for making simple scientific graphs. It is intended for making graphical images of publication quality with minimum effort. For most applications, the program can be device-independent, and the output can be directed to the appropriate device at run time.
The PGPLOT library consists of two major parts: a device-independent part and a set of device-dependent ``device handler'' subroutines for output on various terminals, image displays, dot-matrix printers, laser printers, and pen plotters. Common file formats supported include PostScript and GIF. PGPLOT itself is written mostly in standard Fortran-77.
PGPLOT subroutines can be called directly from a Fortran-77 or Fortran-90 program. A C binding library (cpgplot) and header file (cpgplot.h) are provided that allow PGPLOT to be called from a C or C++ program; the binding library handles conversion between C and Fortran. PGPLOT has been tested with UNIX (most varieties, including Linux, SunOS, Solaris, HPUX, AIX, and Irix) and OpenVMS operating systems.
PGPLOT is not public-domain software. However, it is freely available for non-commercial use. The source code and documentation are copyrighted by California Institute of Technology with a few non-standard, system-dependent subroutines. To get to the installation file and instructions just click here.
Below we present some simple examples of PGPLOT applications in order to demonstrate the capabilities of PGPLOT.
/usr/local/src/pgplot (distribution
directory)
/usr/local/pgplot (target directory)
cd pub/pgplot
binary
hash
get pgplot5.2.tar.gz
tar file.
ftp://ftp.astro.caltech.edu/pub/pgplot/pgplot5.2.tar.gz.
gunzip and tar to decompress the
archive and extract its contents. This will create the directory
pgplot (and subdirectories) in the current directory. Make sure
that your current directory is where you want to create the
``PGPLOT distribution'' directory tree.
cd /usr/local/src
gunzip -c pgplot5.2.tar.gz | tar xvof -
/usr/local/src/pgplot and
subdirectories.
mkdir /usr/local/pgplot
Do not try to create the PGPLOT library in the distribution directory.drivers.list from the
distribution directory to the target directory, and then use a
text editor to select device drivers. This file contains one
line for each available device driver: delete the exclamation
mark (!) at the beginning of the line to include the driver, or
ensure that an exclamation mark is present if you want to
exclude the driver. Many of the drivers can be used only on
certain operating systems (see notes in
drivers.list), so include only the drivers you
plan to use. PGPLOT can later be reconfigured by restarting
the installation at this step. Most installations should
include: the null device (/NULL), PostScript printers (/PS,
/VPS, /CPS, and /VCPS), Tektronix terminals (/TEK, /XTERM, and
possibly other variants), and, if the X window system is
available on the target, the X window drivers (/XWINDOW,
/XSERVE). You may also wish to include drivers for GIF files
(/GIF, /VGIF) or some of the other printers.
    cd /usr/local/pgplot
    cp /usr/local/src/pgplot/drivers.list .
    vi drivers.list         (or use your preferred editor)
makemake, to generate a standard UNIX
makefile for your operating system, compilers, and list of
selected PGPLOT device drivers. Operating-system and compiler
information is obtained from a configuration file.
Configuration files are available for the following systems. If
your configuration is not one of those listed, or if you have
trouble using the generated makefile, see below for information
about creating your own configuration file. f77 invokes the
GNU g77 compiler, then you cannot use a configuration file
designed for, say, a SPARC f77 compiler. You will have to
create a special configuration file. In the following table,
Arg#2 is a code for the operating system, and Arg#3 is a code
for the Fortran and C compilers. For more information about the
supported systems, see the file
pgplot/sys_*/aaaread.me, where * stands for one of
the options for Arg#2.
    Arg#2   Arg#3
    ------  ------
    aix     xlf_cc
    alliant fortran_cc
    bsd     g77_gcc
    convex  fc_cc
    cray    cf77_cc
    epix2   f77_cc         (Control Data EP/IX 2.x)
    freebsd f77_cc
    fujitsu uxpm_frt_cc
    fujitsu uxpv_frt_cc
    hp      fort77_c89
    hp      fort77_gcc
    irix    f77_cc
    linux   absoft_gcc
    linux   f77_gcc
    linux   g77_elf
    linux   g77_gcc
    next    af77_cc
    next    f2c_cc
    next    g77_cc
    next    gf77_cc
    osf1    f77_cc
    osf1    f77_cc_shared
    sol2    f77_cc         (Solaris 2.x, SunOs 5.x)
    sol2    f77_gcc
    sol2    f90_cc
    sol2    g77_gcc
    sun4    f77_acc        (SunOS 4.x)
    sun4    f77_cc
    sun4    f77_gcc
    ultrix  f77_cc
If your system is one of those listed, proceed as follows: Make
the target directory your current default directory, e.g.,
cd /usr/local/pgplot
Execute the script makemake from the distribution
directory: e.g.,
/usr/local/src/pgplot/makemake /usr/local/src/pgplot linux
The first argument supplied to makemake is the
name of the distribution directory. Note that when you run
makemake, your current default directory should be
the target directory, i.e., the directory in which you want to
put the compiled library. drivers.list file. Go back
to step 4!
Example
baybora@bilgi>../pgplot/makemake ../pgplot linux g77_gcc
For additional information, read file ../pgplot/sys_linux/aaaread.me
Reading configuration file: ../pgplot/sys_linux/g77_gcc.conf
Selecting uncommented drivers from ./drivers.list
Found drivers NUDRIV PSDRIV XWDRIV
Creating make file: makefile
Determining object file dependencies.
makemake generates a file
makefile for subsequent use, a Fortran file
grexec.f that calls the selected device drivers,
and a text file rgb.txt that contains color
definitions for use by routine PGSCRN. (If you already have a
file rgb.txt, possibly modified with your own
custom definitions, makemake does not modify it.)
It also copies two Fortran include files that will be needed
during compilation. So at this stage you will have at least the
following files:
drivers.list
grexec.f
grpckg1.inc
makefile
pgplot.inc
rgb.txt
makemake says that it found corresponds to those
you selected in drivers.list. If your UNIX system
is not one of the supported systems listed above, create your
own configuration file in the target directory, with name
local.conf. It is best to copy one of the
configuration files provided (from
pgplot/sys_*/*.conf, and then edit it following
the comments in the file. The makemake procedure
will use local.conf if it exists in the current
directory, and if you do not specify Arg#3. Note that you must
still specify Arg#2 (operating system).
make command to compile the
PGPLOT library following the instructions in
makefile:
make
By default,make will generate: an object-module
library, libpgplot.a; a shareable library (if
possible on the selected operating system), the binary PGPLOT
font file grfont.dat, the demonstration programs
pgdemo*, and a documentation file
pgplot.doc. In addition, if the /XWINDOW and/or
/XSERVE driver was selected in step 4, it will generate a
program pgxwin_server, and if the /XDISP driver
was selected, it will generate a program pgdisp.
If this step proceeds satisfactorily, you may want to type
make clean
to remove not needed intermediate files. You will then have the following files in the current directory:drivers.list
grexec.f
grfont.dat (binary font file)*
libpgplot.a (PGPLOT library)*
libpgplot.so (shared library, optional)*
makefile
pgdemo1 ... pgdemo16 (demonstration programs)
pgdisp (required by /XDISP driver)*
pgplot.doc (ASCII documentation file)
pgxwin_server (required by /XWINDOW driver)*
rgb.txt (color name database)*
pgmdemo (executable demo program)
libXmPgplot.a (object library required by PGPLOT/Motif
applications)*
XmPgplot.h (header file required by PGPLOT/Motif
applications)*
libtkpgplot.a (object library required by PGPLOT/Tk
applications)*
pgtkdemo (executable demo program)
pgtkdemo.tcl (script used by demo program)
tkpgplot.h (header file required by PGPLOT/Tk
applications)*
PGPLOT_DIR is correctly defined. This is the name
of the directory in which PGPLOT will look for the files
grfont.dat and rgb.txt (unless
environment variables PGPLOT_FONT and
PGPLOT_RGB are defined to override this default
behavior), and, if needed, the X-window server program
pgxwin_server:
UNIX csh or tcsh: setenv PGPLOT_DIR /usr/local/pgplot/
UNIX sh or bash: PGPLOT_DIR="/usr/local/pgplot/"; export PGPLOT_DIR
PGPLOT_DEV, e.g.
UNIX csh or tcsh: setenv PGPLOT_DEV /xwindow
When using a UNIX shared library (e.g., on Solaris 2.x), you may also need to put the PGPLOT directory in your loader search path, defined in environment variableLD_LIBRARY_PATH. To run a program, type its name
(with directory if the current directory is not in your path):
./pgdemo1
All the demonstration programs prompt for a device name and type. Type a question mark? to see a list of the
available device types and verify that PGPLOT has been
configured properly. Points to check for: the PGPLOT program
correctly reads the font file and displays superscripts,
subscripts and special characters (pgdemo2); the PGPLOT program
can read the color database (pgdemo10); on interactive devices,
the cursor works correctly (pgdemo5, pgdemo6).
      PROGRAM EX1
      INTEGER PGOPEN, I
      REAL XS(9), YS(9), XR(101), YR(101)

C Compute numbers to be plotted.

      DO 10 I=1,101
          XR(I) = 0.1*(I-1)
          YR(I) = XR(I)**2*EXP(-XR(I))
 10   CONTINUE
      DO 20 I=1,9
          XS(I) = I
          YS(I) = XS(I)**2*EXP(-XS(I))
 20   CONTINUE

C Open graphics device.

      IF (PGOPEN('?') .LT. 1) STOP

C Define coordinate range of graph (0 < x < 10, 0 < y < 0.65),
C and draw axes.

      CALL PGENV(0., 10., 0., 0.65,  0,  0)

C Label the axes (note use of \u and \d for raising exponent).

      CALL PGLAB('x', 'y', 'PGPLOT Graph: y = x\u2\dexp(-x)')

C Plot the line graph.

      CALL PGLINE(101, XR, YR)

C Plot symbols at selected points.

      CALL PGPT(9, XS, YS, 18)

C Close the graphics device.

      CALL PGCLOS

      END
This plots the following graph:
![[example]](../../common/images/article268/example.gif)
g77 your_code_name.f -L/X11directory/ -lX11 -L/PGPLOTdirectory/ -lpgplot
You need to include the following files into the directory where you are running your code:
grfont.dat
rgb.txt
pgwin server
just copy these files from the pgplot directory to the directory where you are running your code.
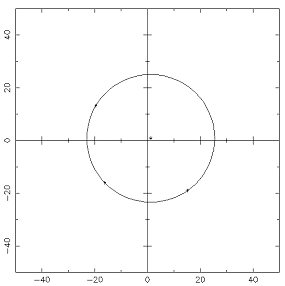
In this application, our aim was to mark three points on the screen via clicking with the mouse and then let Fortran code draw the circle passing through these three points. This problem was an assignment in our Computational Geometry class, conducted by Dr.Serdar Celebi (mscelebi(at)itu.edu.tr).
The following routines define the background and setting for the area that the graph is going to be plotted on. Detailed usage of these subroutines are explained in the PGPLOT manual. (see link to the PGPLOT homepage at the end)
..
...
call PGSCR(0,1.0,1.0,1.0) !set color representation
call PGENV(-50.0,50.0,-50.0,50.0,1,1) !set window and viewport
and draw labeled frame
call PGSCI(1) !set color index
call PGSFS(2) !set fill-area style
...
..
We use the following routine, PGPT1, to draw a pointer at the point we want to mark with the mouse.
..
...
WRITE (*,*) 'Cursor mode:', MODE
             GOTO 10
          END IF
           CALL PGPT1(X, Y, 3)  !draw one graph marker
        ic=ic+1
        xp(i)=x
        yp(i)=y
After we marked 3 different points on the screen, the Fortran code calculates the center and then draws the circle passing through these 3 points.
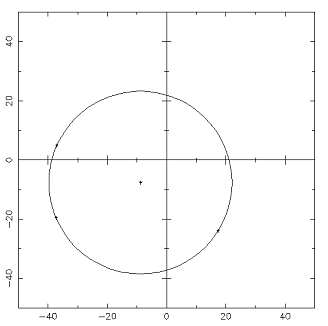
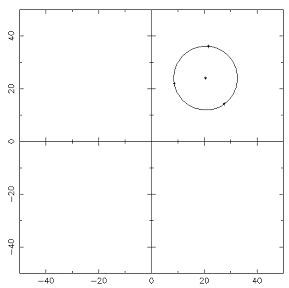
    ..
    ...
    c-----find the radius----------------
     r=(xcenter-xp(1))**2+(ycenter-yp(1))**2
     r=r**0.5
    c-----draw the circle-------------------
     call PGCIRC(xcenter,ycenter,r) !draws a circle
     goto 1
    ...
    ..
We draw the circle with the routine shown above, "PGCIRC". You can clear the pre-drawn circle and assign the points from the beginning to draw another circle on the same drawing area. The complete code is included in the references (see Ref. circle.f).
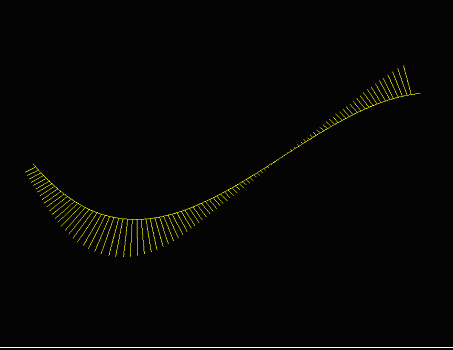
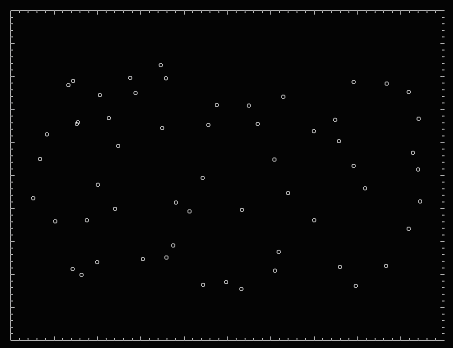
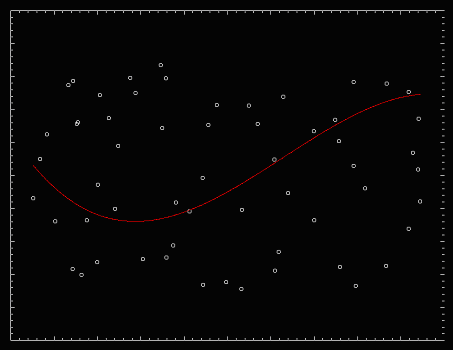
In this application, our aim was to plot an approximation
curve through the various discrete points marked by the mouse
on the screen and then to draw the porcupine lines on this
curve.
The porcupines are the lines that are used to detect
unwanted inflection points, flat parts of a curve, and
discontinuities in curvature. That's why it is an important
concept in Computational Geometry.
We developed a code that uses least square approximation to
draw a curve of the desired order (1~4) through a set of points
which can be randomly generated by the user through a graphical
interface by using the mouse. It has the ability to draw
porcupines on the curve (whose frequency can be adjusted by the
user) is an indicator to the curvature of
the curve.
Skipping the details of the Fortran code we have written, we
present here the graphical results (You find the code at the
end of the article).
We first enter discrete points on the screen with the mouse and the Fortran code takes the coordinates of these points and stores them in an array. Then it approximates the curve passing through these points at the degree the user indicates.(1-4)
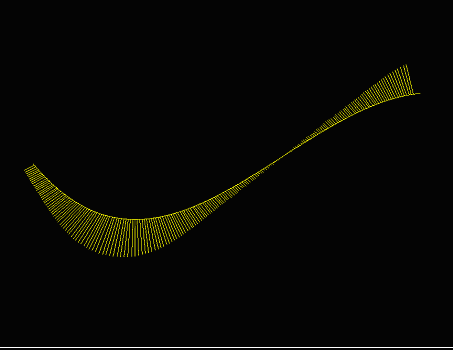
Then the porcupine lines are drawn on the curve. The number of porcupine lines can be modified by the user, and without changing the background or the points the new set of porcupines can be drawn on the same curve.
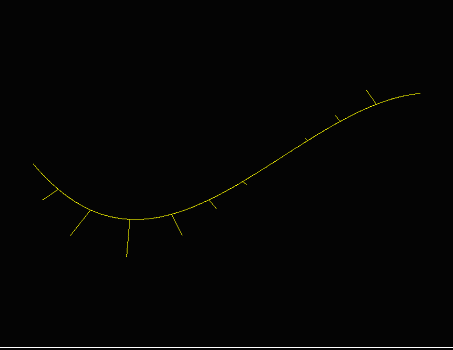
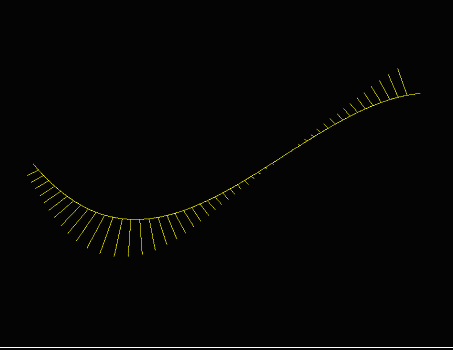
The frequency of the porcupines can also be increased as seen below. Also the program can draw a new curve on the same set of data.